-Set up Builders level.
-Use of Pegs,Sledge Hammer,Maul,Sopworth Staff,Measure Tape,Tripod and Builders level.
-To get measurements/heights in a straight line for a straight line cross section contour graph.
 |
| Pegs being driven in by sledge hammer. |
 |
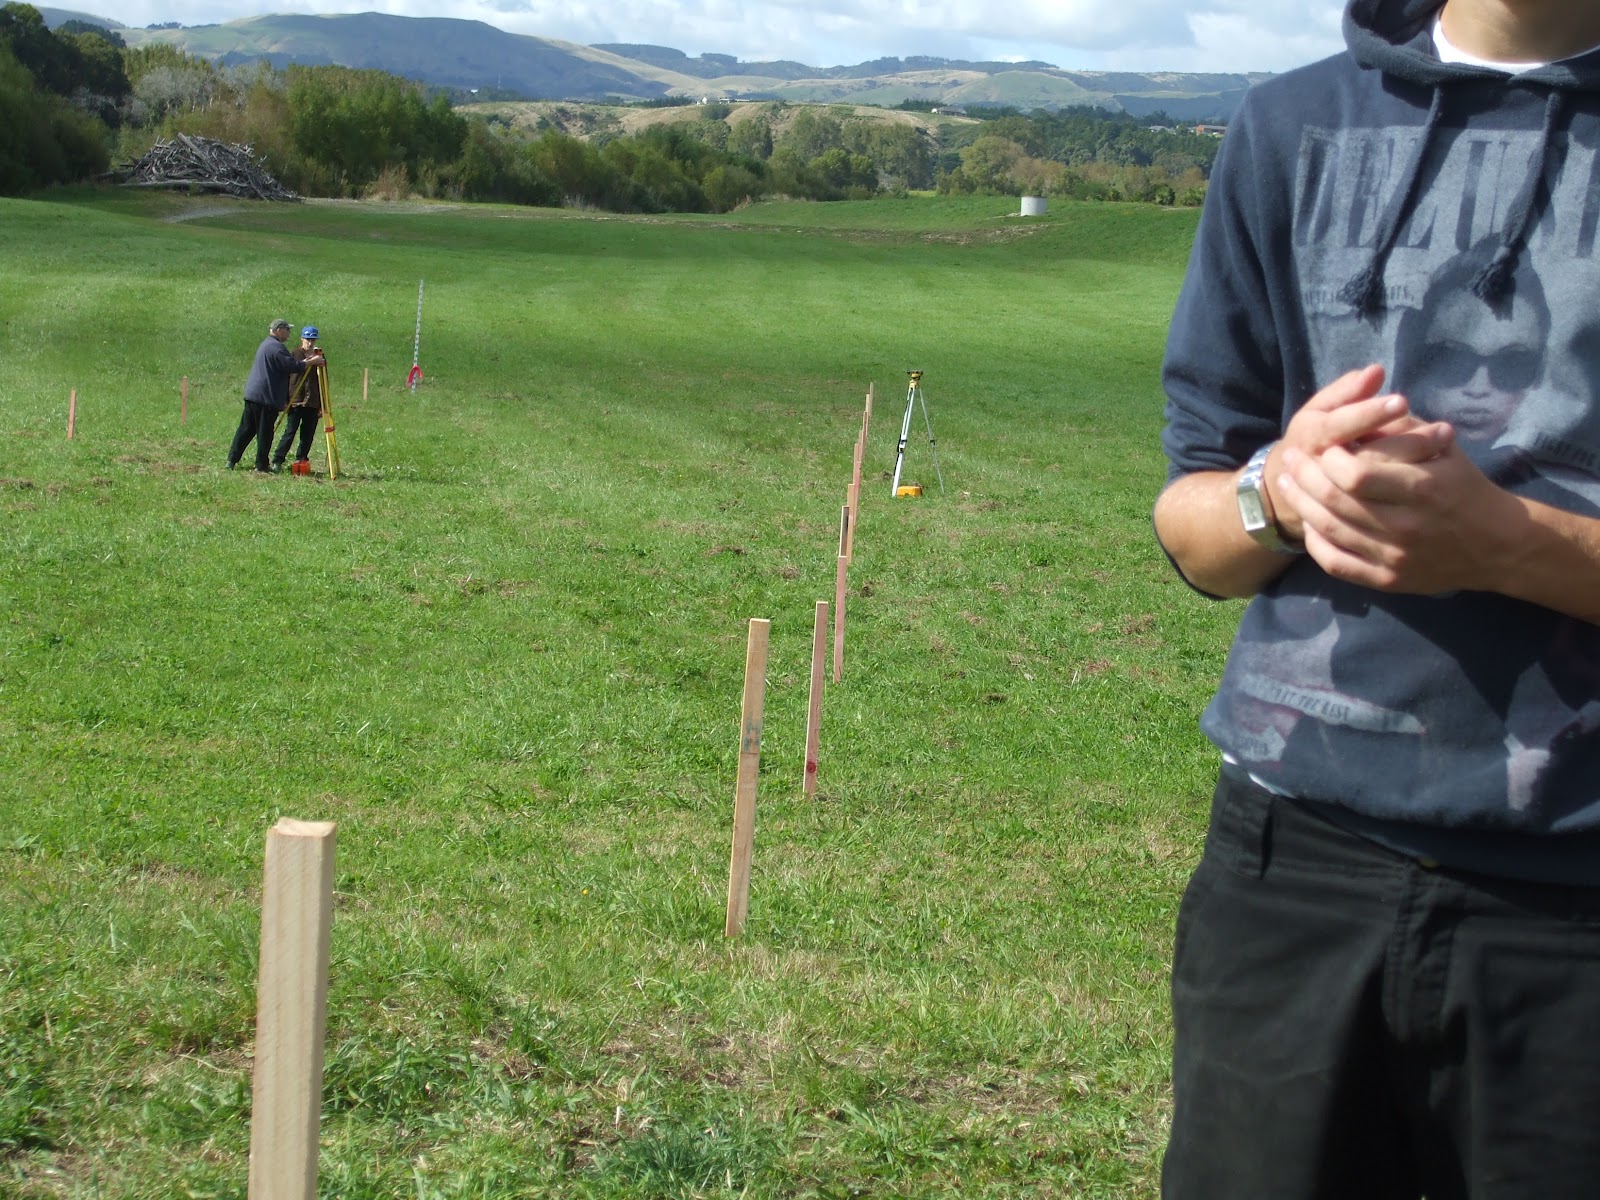
| Half of our straight line for the contour cross section graph. |
 |
| Builders Level I set up. |
 |
| Cam giving instructions. |
So Today we all met up in the EShed as normal.We were given a sheet of paper to record our Back site,Intermediate site,Fore site,Rise,Fall,Reduced Level,Distance and Remark on.Once we were given this the lecturers explained what was to be recorded.Once we arrived to the river we were broken down into four individual groups.I paced out 50 steps in one direction from the top of the hill and another 50 on the opposite side.We then as a group placed the tape measure down and sledged in the pegs in 5 metre increments.Once we had done that we stationed the Tripod and Builders level at our first mark(Back site).From then we grabbed our first few readings off the staff that was held at every peg.We re stationed five times so everybody had a turn at each task.Once we had gained our heights we headed back to UCOL to be given a Cross section contour graph.We were all shown how to get our rise and fall numbers.We did this by taking the first intermediate site and subtracting it by the backsite,after that it was the first IS take away the following ect.If the answer was a + then it was added to the Rise,if it was a - then it was added to the Fall.Next up was the Reduced level,We started at 100 metres above sea level.and for the rise and fall we added and subtracted the numbers to get an end result.After we had gained the end result we took the last reduced measure and subtracted it by the first to get a mean,The next totals should match this.Then we added all the backsights and fore sites together then took them away from each other,the number we got matched the same end result as the Reduced level.We repeated the same method for the Rise and fall.After all of the numbers were sorted I constructed a graph showing 11 of the numbers forming a side on view of the rough terrain.
 |
| My Straightline cross section contour graph. |
 |
| My field data. |


No comments:
Post a Comment